Anyone who has ever done any serious development is well familiar with “it works on my machine” syndrome. Issues that can not be reproduced on development machine are hard to troubleshoot and may lead to a lot of frustration. Using Visual Studio and remote debugger are helpful tools in dealing with this type of problems.
The remote debugger setup
The remote debugger utility is an optional component of Visual Studio installation. It is by default installed under “C:\Program Files\Microsoft Visual Studio 9.0\Common7\IDE\Remote Debugger” folder. If for some reason you cannot find it there you can always download it from here. Remote debugger is a standalone utility that can be either installed or copied to the machine where the application to be debugged is located. It is important to install correct version since there are versions for x86, x64, and IA64 architectures. Installing x86 assembly on x64 machine will not allow you to debug x64 processes. Once the remote debugger has been installed we need to run it and configure it. Configuration setup is code dependent (Managed vs. Native). On first invocation a warning screen will be presented:
Choose an appropriate option for you environment and click OK. The main dialog will be presented:
Managed code remote debugger configuration
Managed code applications do not require any special configuration.
Native code remote debugger configuration
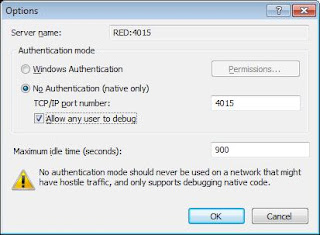
Native code applications require permissions to be modified. Click “Tools->Options” and select options as show on the picture:
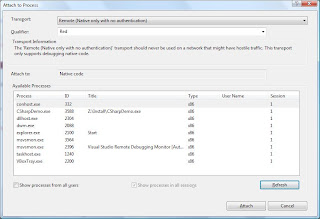
We need to go back to the development machine and use Visual Studio to attach to the remote process of the application being debugged. In Visual Studio click “Debug->Attach to process” or press Ctrl+Alt+P to bring up the process dialog.
Managed code debugging
The “Default” option needs to be chosen for “Transport” parameter. For “Qualifier” enter the user name the remote debugger is running under plus “@” and remote machine name. For instance, in my case the remote debugger is using user name “slobo” on machine named “Red”. The “Qualifier” looks like this: “slobo@RED”. In “Attach to” selection box select “Managed code”. Now you should be able to see all the processes running on the remote machine:
Select the process and click “Attach”.
If firewall was setup properly you should be able to debug the application as if it was running locally on the development machine.


